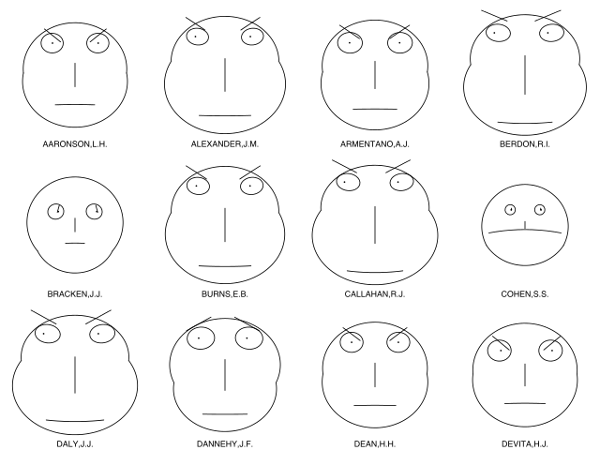
Humans are bad at evaluating complex data, but we’re good at reading faces. So in 1973 Stanford statistician Herman Chernoff proposed using cartoon faces to encode information. He found that up to 18 different data dimensions can be represented in a computer-drawn face, mapping one variable to the length of the nose, another to the space between the eyes or the position of the mouth, and so on. This produces an array of faces that we can assess quickly using the brain’s natural talent for reading features. (The example above shows lawyers’ ratings of state judges in U.S. Superior Court.)
“This approach is an amusing reversal of a common one in artificial intelligence,” Chernoff noted. “Instead of using machines to discriminate between human faces by reducing them to numbers, we discriminate between numbers by using the machine to do the brute labor of drawing faces and leaving the intelligence to the humans, who are still more flexible and clever.”
(Herman Chernoff, “The Use of Faces to Represent Points in K-Dimensional Space Graphically,” Journal of the American Statistical Association 68:342 [June 1973], 361-368.)
