The Butterfly Theorem

https://commons.wikimedia.org/wiki/File:Butterfly_theorem.svg
Image: Wikimedia Commons

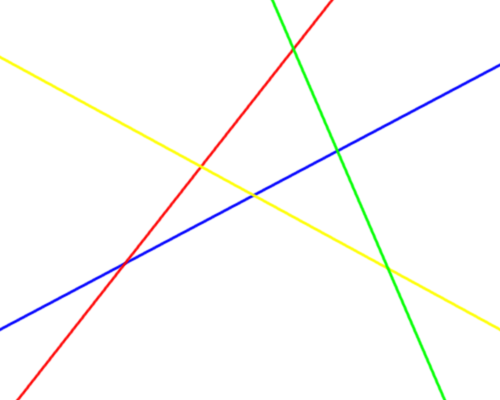
Draw a circle, choose any chord PQ, and draw two further chords AB and CD through its midpoint M. Now, if AD and BC intersect PQ at X and Y, M will always be the midpoint of XY.

In Icons of Mathematics (2011), Claudi Alsina and Roger Nelsen write, “The surprise is the unexpected symmetry arising from an almost random construction.” The theorem first appeared in 1815.

Averageness

galton criminal composites

In 1883 Francis Galton tried an experiment: He combined multiple photographs of criminals into composite images, hoping to discover an underlying “type.” He didn’t get a strong result, but he did notice something odd about the composite faces: They tended to be more attractive than the individual images that made them up. He found similar effects with other groups — a composite “sick person” seemed healthier than its constituent images, and a group of good-looking people became even more beautiful in composite. In one case he made a “singularly beautiful combination of the faces of six different Roman ladies, forming a charming ideal profile.”

The lesson seems to be that we find an “average” face most attractive — a face is appealing not because it has unusual features but because it lacks them. For example (below), a University of Toronto study found that the shape of Jessica Alba’s face approaches the average for all female profiles: The distance between her pupils is 46 percent of the width of her face, and the distance between her eyes and her mouth is 36 percent of the length of her face. The fact that we find this attractive makes some evolutionary sense: Natural selection tends to drive out disadvantageous features, so a partner with an “average” face is more likely to be healthy and fertile.

https://commons.wikimedia.org/wiki/File:Jessica_Alba_Face_Proportions.png
Image: Wikimedia Commons

Straight and Narrow

https://commons.wikimedia.org/wiki/File:Peaucellier_linkage_animation.gif
Image: Wikimedia Commons

A.B. Kempe’s provocatively titled How to Draw a Straight Line (1877) addresses a fundamental question. In the Elements, Euclid derives his results by drawing straight lines and circles. We can draw a circle by rotating a rigid body (such as a pair of compasses) around a fixed point. But how can we produce a straight line? “If we are to draw a straight line with a ruler, the ruler must itself have a straight edge; and how are we going to make the edge straight? We come back to our starting-point.”

Kempe’s solution is the Peaucellier–Lipkin linkage, an ingenious mechanism that was invented in 1864 by the French army engineer Charles-Nicolas Peaucellier, forgotten, and rediscovered by a Russian student named Yom Tov Lipman Lipkin. In the figure shown here, the colors denote bars of equal length. The green and red bars form a linkage called a Peaucellier cell, and adding the blue links causes the red rhombus to flex as it moves. A pencil fixed at the outer vertex of the rhombus will draw a straight line.

James Sylvester introduced Peaucellier’s discovery to England in a lecture at the Royal Institution in January 1874, which Kempe says “excited very great interest and was the commencement of the consideration of the subject of linkages in this country.” Sylvester writes that when he showed a model of the linkage to Lord Kelvin, he “nursed it as if it had been his own child, and when a motion was made to relieve him of it, replied ‘No! I have not had nearly enough of it — it is the most beautiful thing I have ever seen in my life.'”

The Pythagoras Tree

Draw a square and perch two smaller squares above it, forming a right triangle:

https://commons.wikimedia.org/wiki/File:PythagorasTree1.png

Now perch still smaller squares upon these, and continue the pattern recursively:

https://commons.wikimedia.org/wiki/File:PythagorasTree3.png

Charmingly, if you keep this up you’ll grow a tree:

https://commons.wikimedia.org/wiki/File:Pythagoras_tree_1_1_13_Summer.svg
Image: Wikimedia Commons

It was dubbed the Pythagoras tree by Albert Bosman, the Dutch mathematics teacher who discovered the figure in 1942. (Each trio of squares demonstrates the Pythagorean theorem.)

At first it looks as though the tree must grow without bound, but in fact it’s admirably tidy: Because the squares eventually begin to overlap one another, a tree sprouted from a unit square will confine itself to a rectangle measuring 6 by 4.

Dueling Pennies

A certain strange casino offers only one game. The casino posts a positive integer n on the wall, and the customer flips a fair coin repeatedly until it falls tails. If he has tossed n – 1 times, he pays the house 8n – 1 dollars; if he’s tossed n + 1 times, the house pays him 8n dollars; and in all other cases the payoff is zero.

The probability of tossing the coin exactly n times is 1/2n, so the customer’s expected winnings are 8n/2n + 1 – 8n – 1/2n – 1 = 4n – 1 for n > 1, and 2 for n = 1. So his expected gain is positive.

But suppose it turns out that the casino arrived at the number n by tossing the same fair coin and counting the tosses, up to and including the first tails. This presents a puzzle: “You and the house are behaving in a completely symmetric manner,” writes David Gale in Tracking the Automatic ANT (1998). “Each of you tosses the coin, and if the number of tosses happens to be the consecutive integers n and n + 1, then the n-tosser pays the (n + 1)-tosser 8n dollars. But we have just seen that the game is to your advantage as measured by expectation no matter what number the house announces. How can there be this asymmetry in a completely symmetric game?”

Visual Calculus

https://commons.wikimedia.org/wiki/File:Cycloid_(PSF).png

As a circle rolls along a line, a point on its circumference traces an arch called a cycloid. The arch encloses an area three times that of the circle, a result commonly proven using calculus. Now Armenian mathematician Mamikon Mnatsakanian has devised a “sweeping-tangent theorem” that accomplishes the same proof using intuition:

https://commons.wikimedia.org/wiki/File:Mamikon_Cycloid.svg
Image: Wikimedia Commons

Imagine a tangent to the rolling circle. As the circle rolls, the tangent sweeps out a series of vectors (approximated here using colors). If these vectors are then gathered to a common point while preserving their length and orientation, they form a sort of bouquet whose size and shape turn out to match exactly those of the original circle. Because the enclosing rectangle has four times the area of the rolling circle (2πr × 2r = 4πr2), this shows that the area under the arch has three times the circle’s area.

All this is proven rigorously in Mnatsakanian’s 2012 book New Horizons in Geometry, written with his Caltech colleague Tom Apostol. The two have now collaborated on some 30 papers showing that many surprising and useful results that heretofore had required integration can now be obtained using intuitive methods that can appeal even to a young student.

That’s a welcome outcome for Mnatsakanian, who found himself stranded in the United States when the Armenian government collapsed in 1990. Apostol writes, “When young Mamikon showed his method to Soviet mathematicians they dismissed it out of hand and said ‘It can’t be right. You can’t solve calculus problems that easily.'”

Hesiod’s Anvil

https://commons.wikimedia.org/wiki/File:Acme_anvil.gif

How far off is heaven? In the Theogony Hesiod gives us a clue:

For a brazen anvil falling down from heaven nine nights and days would reach the earth upon the tenth; and again, a brazen anvil falling from earth nine nights and days would reach Tartarus upon the tenth.

How far can an anvil fall in nine days? Galileo, who taught that “the distances measured by the falling body increase according to the squares of the time,” would have determined that the anvil starts 2.96 × 10⁹ km from earth, a distance greater than that between the sun and Uranus.

But Galileo’s calculation assumes that gravitational force is independent of the object’s distance from the earth. If we assume instead that it varies inversely with the square of the distance between mass centers (and if we ignore all masses except those of the earth and the anvil, and assume that the anvil falls in a straight line), King College mathematician Andrew Simoson calculates that Galileo’s anvil wouldn’t reach us for

hesiod's anvil calculation

Instead, under this new assumption, to reach us in nine days an anvil would start 5.81 × 10⁵ km away — about one and a half times the distance between the earth and the moon.

(Andrew J. Simoson, Hesiod’s Anvil, 2007.)

Rolling Average

http://www.freeimages.com/photo/549165

In a standard 10-frame game of bowling, the lowest possible score is 0 (all gutterballs) and the highest is 300 (all strikes). An average player falls somewhere between these extremes. In 1985, Central Missouri State University mathematicians Curtis Cooper and Robert Kennedy wondered what the game’s theoretical average score is — if you compiled the score sheets for every legally possible game of bowling, what would be the arithmetic mean of the scores?

It turns out it’s pretty low. There are (669)(241) possible games, which is about 5.7 × 10¹⁸. If we divide that into the total number of points scored in these games, we get

mean bowling score

which is about 80 (79.7439 …).

This “might make you feel better about your average,” Cooper and Kennedy conclude. “The mean bowling score is indeed awful even if you are just an occasional bowler. Even though this information is interesting, there are more difficult questions about the game of bowling that could be asked. For example, you might wish to determine the standard deviation of the set of bowling scores and hence know more about the distribution of the set of all bowling scores. But the exact determination of the distibution of the set of scores is, in our opinion, a difficult problem. For example, given an integer k between 0 and 300, how many different bowling games have the score k? This, we leave as an open problem.”

(Curtis N. Cooper and Robert E. Kennedy, “Is the Mean Bowling Score Awful?”, Journal of Recreational Mathematics 18:3, 1985-86.)

Golomb Rulers

https://commons.wikimedia.org/wiki/File:Golomb_ruler_conference_room.svg
Image: Wikimedia Commons

This conference room is 11 units long and has folding partitions at positions 2, 7, and 8. This gives it a curious property: For a meeting of any given size, the room can be configured in exactly one way. A meeting of size 6 must use partitions 2 and 8 — no other setup will work exactly.

This is an example of a Golomb ruler, named for USC mathematician Solomon Golomb. It’s called a ruler because the simplest example is a measuring stick: If we’re given a 6-centimeter ruler, we find that we can add 4 marks (at integer positions) so that no two of them are the same distance apart: 0 1 4 6. No shorter ruler can accommodate 4 marks without duplication, so the 0-1-4-6 ruler is said to be “optimal.” It’s also “perfect” because it can measure any distance from 1 to 6.

The conference room is optimal because no shorter room can accommodate 5 walls without equal-sized partitions becoming available, but it’s not perfect, because it can’t accommodate an assembly of size 10. (It turns out that no perfect ruler with five marks is possible.)

Finding optimal Golomb rulers is hard — simply extending an existing ruler tends to produce a new ruler that’s either not Golomb or not optimal. The only way forward, it seems, is to compare every possible ruler with n marks and note the shortest one, an immensely laborious process. Distributed computing projects have found the longest optimal rulers to date — the most recent, with 27 marks, was found in February, five years after the previous record.