I’d missed this: In 2006 a geneticist, a philosopher, and a chicken farmer all agreed that the egg came before the chicken.
Nottingham University geneticist John Brookfield pointed out that the first chicken (the first creature bearing chicken DNA) must have begun as an embryo in an egg. “The first living thing which we could say unequivocally was a member of the species would be this first egg, so I would conclude that the egg came first.”
David Papineau, philosopher of science at King’s College, London, agreed. “I would argue it is a chicken egg if it has a chicken in it. … If a kangaroo laid an egg from which an ostrich hatched, that would surely be an ostrich egg, not a kangaroo egg.”
And Charles Bournes, chair of trade body Great British Chicken, said, “Eggs were around long before the first chicken arrived. Of course they may not have been chicken eggs as we see them today, but they were eggs.”
According to the BBC, “Professor Brooke added the debate could finally be laid to rest.”
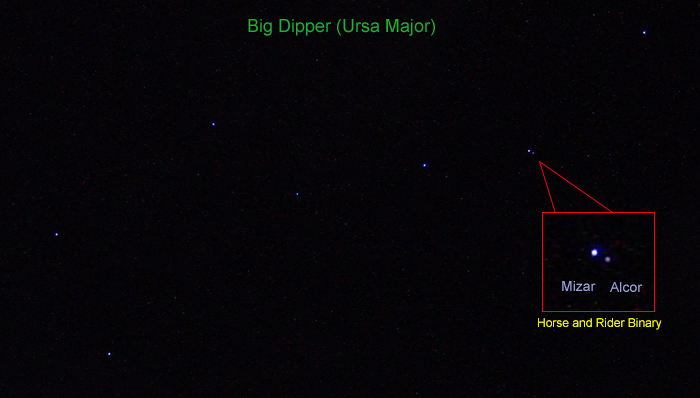
The second star in the Big Dipper’s handle is actually two stars, Mizar and Alcor. Distinguishing the two with the naked eye has been used as a test of vision for hundreds of years. Arabic tradition held that only those with the sharpest eyesight could see Mizar’s companion, and the 13th-century Persian astronomy writer Zakariya al-Qazwini wrote that “people tested their eyesight by this star.” In Japan, it was said that being unable to see Alcor with the naked eye foretold an impending death of old age, and Alexander von Humboldt and François Arago both noted that Alcor can be seen only with difficulty.
In The Herschels and Modern Astronomy (1901), Irish astronomer Agnes Mary Clerke wrote, “The Arabs in the desert regarded it as a test of penetrating vision; … Vidit Alcor, at non lunam plenam (Latin for ‘he saw Alcor, but not the full moon’), came to be a proverbial description of one keenly alive to trifles, but dull of apprehension for broad facts.”
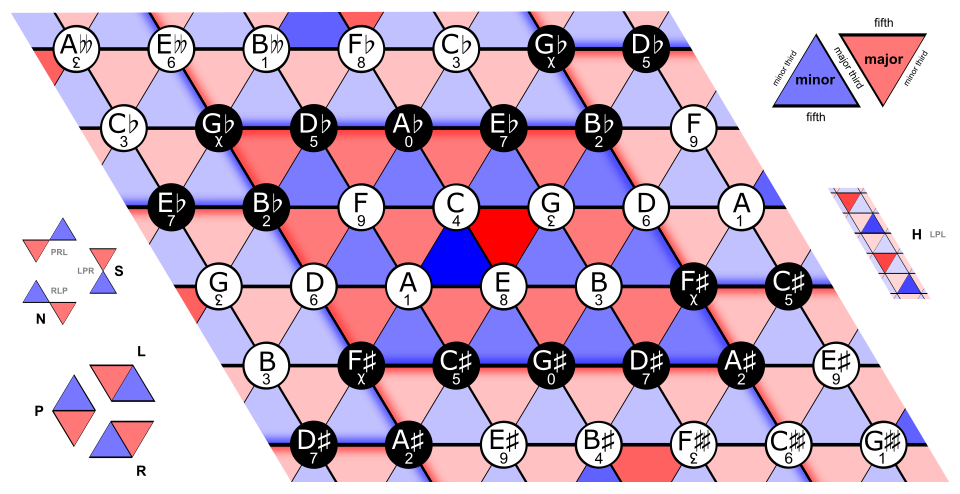
In 1739, Leonhard Euler devised a “tone net” to represent graphically the traditional harmonic relationships in European classical music. In the version above, the dark blue triangle at the center is an A minor triad; the red triangle to its right is the relative major, C; and the red triangle below it is the parallel major, A. Every such pattern is mirrored in all the other keys. The tones are numbered from 0 (A♭) to 11 (G). Major triads are red, and minor are blue. The thinnest lines denote minor thirds, thicker are major thirds, and the thickest horizontal lines are fifths. See this page for further relationships.
The heart of the figure, shown in somewhat darker colors in the diagram, is a parallelogram composed of 24 triangles. The top edge of this parallelogram can be joined to the bottom, which lists the same notes in their enharmonic equivalents, and if the resulting cylinder is twisted slightly then its ends can be joined in the same way, forming a torus.
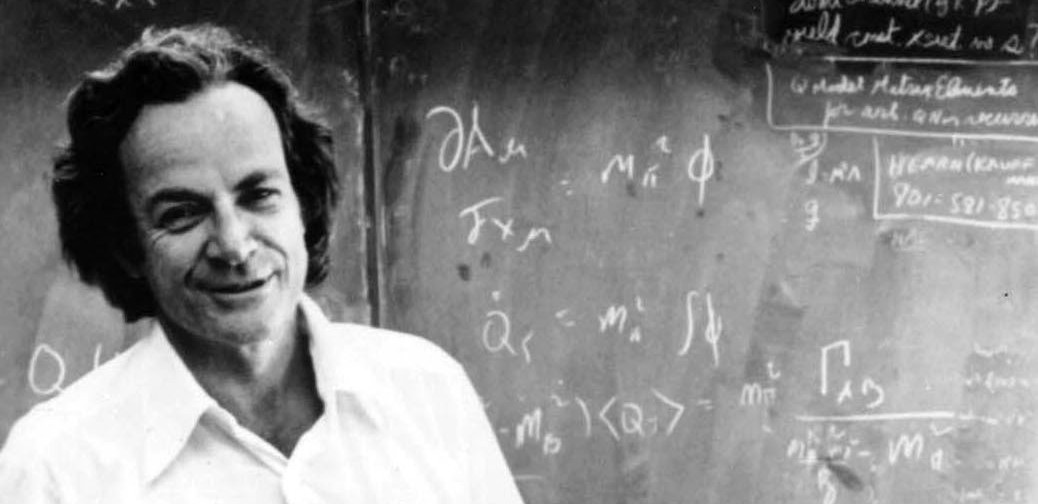
In the late 1970s, Richard Feynman visited a Thai restaurant in Glendale, California, for lunch with his friend Ralph Leighton. Leighton wondered whether he should order his favorite dish, the ginger chicken, or try something new. Feynman, on the spot, scribbled out a solution: If the ginger chicken didn’t exceed a certain high threshold, Leighton ought to try a new dish. But the threshold descended over time — on Leighton’s final visit to the restaurant, for example, it would make more sense to choose a meal he knew he’d enjoy rather than to gamble on an untested candidate.
Leighton kept Feynman’s notes, but his mathematical reasoning remained undeciphered for 50 years. Now Berkeley computational cognitive scientist Brian Christian and his colleagues have established Feynman’s argument and published it in the Proceedings of the National Academy of Sciences.
They also ran an experiment with 2,520 participants to see whether people actually follow this advice. They found that “people adapt linear thresholds used in optimal stopping tasks in a way that is sensitive to the underlying distribution — a simple strategy that we show is nearly as effective as Feynman’s solution.”
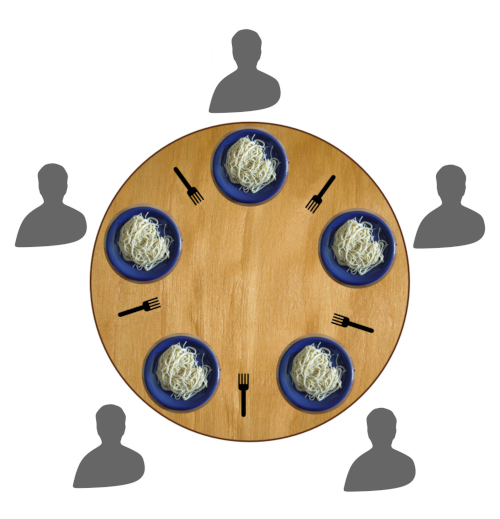
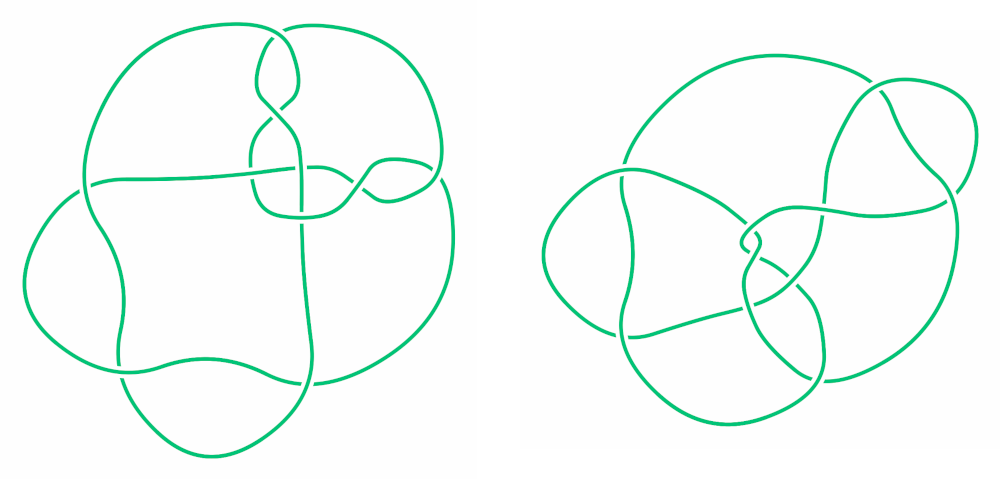
Five philosophers dine together at the same table. Each philosopher has their own plate at the table. There is a fork between each pair of adjacent plates. The dish served is a kind of spaghetti which has to be eaten with two forks. Each philosopher can only alternately think and eat. Moreover, a philosopher can only eat their spaghetti when they have both a left and a right fork. Thus, two forks will only be available when their two nearest neighbors are thinking, not eating. After an individual philosopher finishes eating, they will put down both forks. The problem is how to design a regimen (a concurrent algorithm) such that any philosopher will not starve; i.e., each can forever continue to alternate between eating and thinking, assuming that no philosopher can know when others may want to eat or think (an issue of incomplete information).
In a carnival game, you roll seven ordinary dice and then arrange them to form a 7-digit number.
If your number is a multiple of 2, you’ll win £2.
If your number is a multiple of 3, you’ll win £3.
If your number is a multiple of 4, you’ll win £4.
If your number is a multiple of 5, you’ll win £5.
If your number is a multiple of 6, you’ll win £6.
If your number is a multiple of 7, you’ll win £7.
The catch is that you have to announce the prize you’re attempting before you roll the dice. Which prize should you pick?
At first it seems that the £2 prize must be best. If even one of the seven dice produces an even number, you can put that at the end of string and fulfill the condition. This will happen 99.2 percent of the time.
Surprisingly, though, choosing 7 has an even higher success rate, 99.997 percent! “In fact, almost all numbers can be rearranged to make a multiple of 7,” writes James Grime. “But finding the multiple of 7 is the tricky part.” See the paper below for a strategy that will win the jackpot nearly every time.
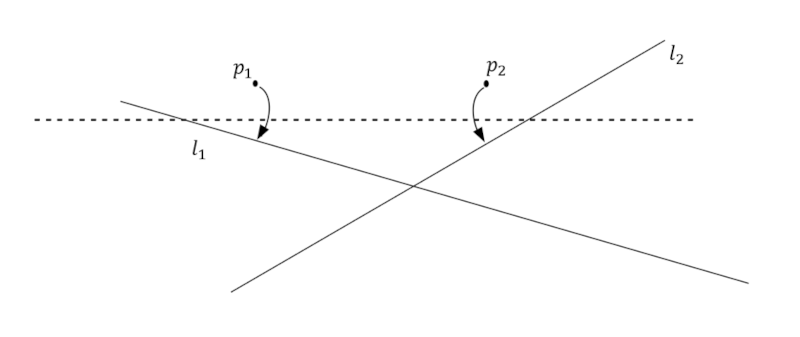
Origami can solve general cubic equations! The method was developed by Italian mathematician Margherita Piazzolla Beloch, who in 1936 found a way to use paper folding to construct the common tangents to two parabolas.
Given two points p1 and p2 and two lines l1 and l2, we can, whenever possible, make a single fold (dashed line) that puts p1 onto l1 and p2 onto l2 simultaneously. This fold finds a common tangent to two parabolas: one with focus p1 and directrix l1, the other with focus p2 and directrix l2.
“Now, two parabolas drawn in the plane can have at most three different common tangents, suggesting that this origami fold is equivalent to solving a cubic equation,” writes Western New England College mathematician Thomas C. Hull. “Straightedge and compass constructions, on the other hand, can only solve general quadratic equations.”
Beloch’s contribution went uncredited for decades, but it’s now receiving a fuller appreciation. See the 2011 paper below for more details.
The Javan cucumber, Alsomitra macrocarpa, broadcasts its seeds on papery wings that can glide long distances. Some have been found on the decks of ships.
The unique design inspired aviation pioneer Igo Etrich to build an artificial flying wing, which he adapted into Germany’s first mass-produced military aeroplane.