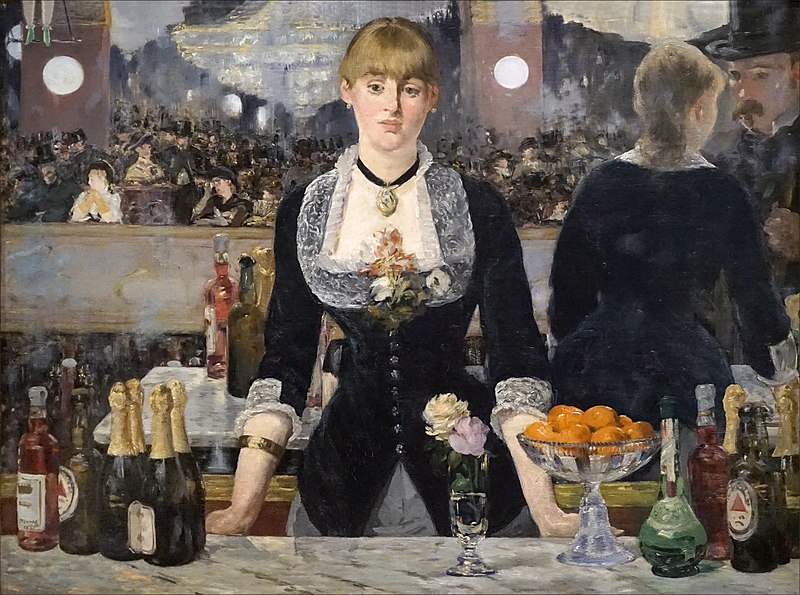
Manet’s painting A Bar at the Folies-Bergère is sometimes criticized for its confused composition. The bottles to the barmaid’s right stand near the back of the bar, but in the reflection behind her they stand near the front. Her own image ought to stand behind her, not off to the right. And reflection of the man she’s addressing (in the position of the painter, or the viewer) ought also to be behind her — indeed, she herself should be blocking our view of it.
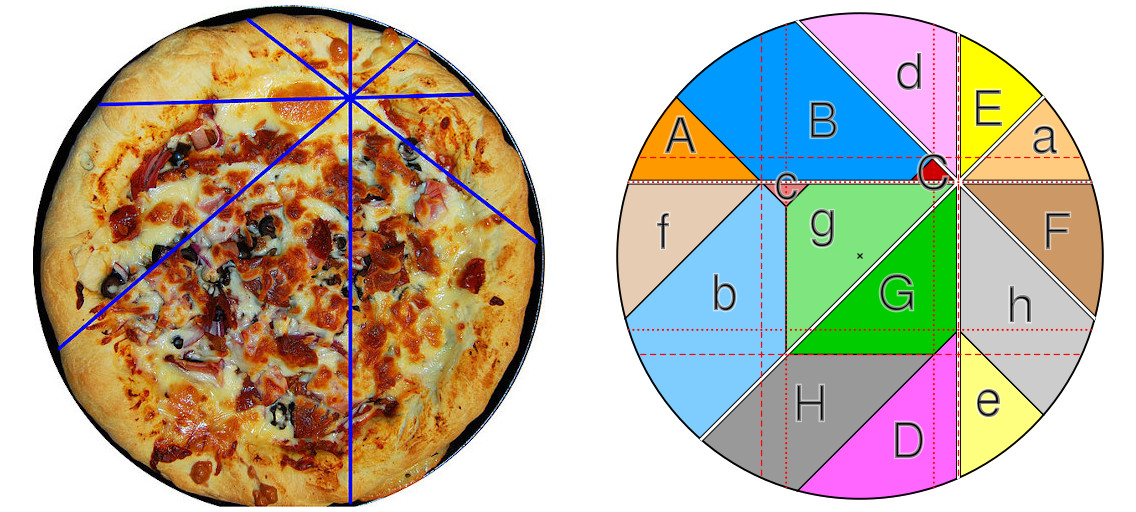
But in a dissertation at the University of New South Wales, art historian Malcolm Park found that the arrangement makes sense if certain assumptions are reconsidered. The barmaid is facing the viewer across the bar, with a mirror behind her. But she’s looking diagonally along the bar, not directly across it. (See the diagram here.)
The bottles in the background and the man she appears to be addressing are both in fact to the viewer’s left, beyond the edge of the frame and so visible only as reflections. And the barmaid’s own reflection appears to our right because, from our perspective, the mirror is not directly behind her — it’s “turned” somewhat, carrying her image over to one side.
(Malcolm Park, Ambiguity and the Engagement of Spatial Illusion Within the Surface of Manet’s Paintings, dissertation, College of Fine Arts, University of New South Wales, 2001.)