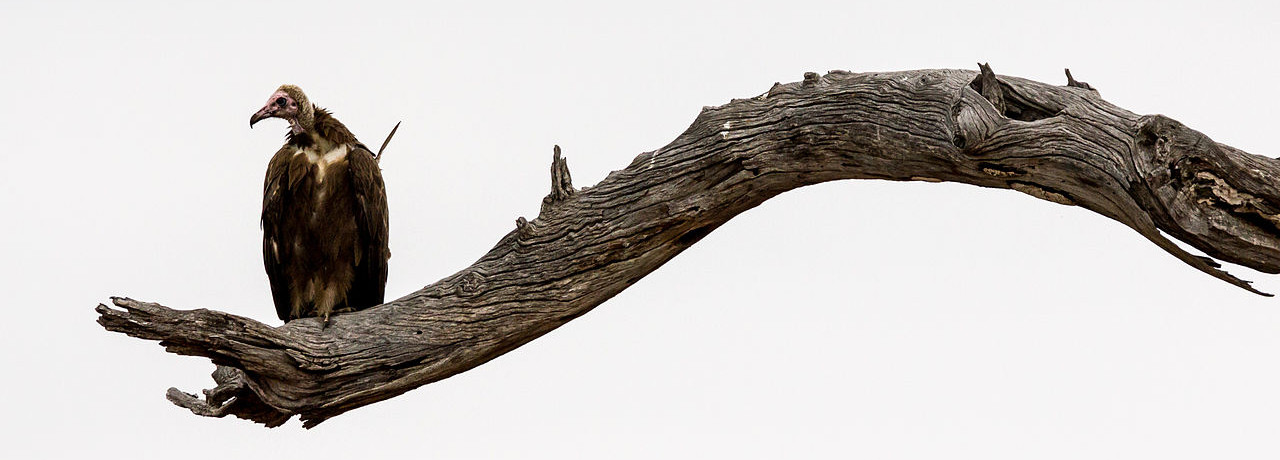
Shortcuts

In a lecture at the University of Edinburgh in the 1970s, artificial intelligence pioneer I.J. Good pointed out that a robot cricket player doesn’t necessarily need a complex knowledge of physics in order to catch a ball — instead it might emulate humans, who follow a simple rule: “If the ball appears to be rising in the sky, run backwards. If it is falling, run towards it.”

Similarly, Hope College mathematician Tim Pennings noticed that his Welsh corgi, Elvis, seemed to follow the optimal path when chasing a ball thrown into Lake Michigan — Elvis seemed to realize that he ran faster than he swam, and so could minimize his retrieval time by racing intelligently along the beach before jumping into the water. But how did he make these judgments?

“We confess that although he made good choices, Elvis does not know calculus,” Pennings wrote. “In fact, he has trouble differentiating even simple polynomials.”

(Timothy J. Pennings, “Do Dogs Know Calculus?” College Mathematics Journal 34:3 [2003], 178-182.)

Friendly Fire

Here’s a little oddity that I just came across. John Conway’s Game of Life is a familiar recreation that takes place on a grid of squares. At the start each square is either “alive” or “dead,” and then on each turn the status of each square is updated:

  1. Any live cell with fewer than two live neighbors dies (as if by underpopulation)
  2. Any live cell with two or three live neighbors lives on
  3. Any live cell with more than three live neighbors dies (as if by overpopulation)
  4. Any dead cell with exactly three live neighbors becomes a live cell (as if by reproduction)

This produces some surprising creatures, such as the “glider,” a self-propagating “spaceship” that travels diagonally:

https://commons.wikimedia.org/wiki/File:Game_of_life_animated_glider.gif

Gliders can be generated by an oscillating factory called a “gun”:

https://commons.wikimedia.org/wiki/File:Gospers_glider_gun.gif
Image: Wikimedia Commons

Here’s the oddity: It would seem that each gun will produce an infinite fleet, since its gliders all depart in the same direction. But that’s not true if the grid of squares is written on a torus — then the gliders snake around the figure and destroy their maker:

https://commons.wikimedia.org/wiki/File:Long_gun.gif

Memorable Numbers

https://pixabay.com/en/pay-digit-number-fill-count-mass-1036480/

In 1995 psychologists Marisca Milikowski and Jan Elshout tested 597 undergraduates to see which of the numbers 1-100 they found easiest and hardest to remember. The students were given 90 seconds to memorize an array of numbers from this range; after an hour’s interval they were given another 90 seconds to recall the numbers they’d seen.

The most successfully recalled numbers were 8, 1, 100, 2, 17, 5, 9, 10, 99, and 11, and the least 82, 56, 61, 94, 85, 45, 83, 59, 41, and 79. The most memorable categories seem to be single-digit numbers; “teen” numbers (10-19); doubled numbers such as 22 and 44; and numbers that appear in multiplication tables, such as 49 and 36.

Interestingly, when the experimenters asked the subjects to rate numbers subjectively as “good” or “bad,” all the numbers judged good belonged to one of these privileged categories, and none of the bad numbers did.

(Marisca Milikowski and Jan J. Elshout, “What Makes a Number Easy to Remember?” British Journal of Psychology 86 [November 1995], 537-47.)

Two Puzzles

This just caught my eye: In the centenary issue of the Mathematical Gazette, in 1996, Sir Bryan Thwaites offered monetary prizes for the proofs of two conjectures.

The first is what’s known as the Collatz conjecture, which Sir Bryan had been puzzling over since 1951. He had come to believe it was unprovable, so he offered a prize of £1,000.

The second conjecture was “even simpler as far as numerical skill is concerned”:

Take any set of N rational numbers. Form another set by taking the positive differences of successive members of the first set, the last such difference being formed from the last and first members of the original set. Iterate. Then in due course the set so formed will consist entirely of zeros if and only if N is a power of two.

Sir Bryan felt that this conjecture was likely provable, so he offered £100 for its proof or disproof.

“Both are easily understood and handled by the average ten-year-old,” he wrote, “and so there will be some who will attribute my continuing interest in such apparently elementary mathematics to well-advanced senility.” But that was 20 years ago, and I believe both conjectures remain unproven — the first is a famously unsolved problem, and I can’t find any record that the second has ever been worked out (though evidently the case of N = 4 had been known since the 1930s).

(Bryan Thwaites, “Two Conjectures or How to Win £1100,” Mathematical Gazette 80:487 [March 1996], 35-36.)

12/03/2018 UPDATE: It has been proven. (Thanks, Yotam.)

The Peters Projection

https://commons.wikimedia.org/wiki/File:Peters_projection,_date_line_in_Bering_strait.svg

In 1967 German filmmaker Arno Peters promoted a new map of the world in which areas of equal size on the globe appear of equal sizes on the map, so that poor, less powerful nations near the equator are restored to their rightful proportions.

Peters promoted the map by comparing it the popular Mercator projection, which is useful to navigators but makes Europe appear larger than South America and Greenland larger than China.

Peters’ goal was to empower underdeveloped nations, which he felt had suffered from “cartographic imperialism.” But his own map badly distorts the polar regions — cartographic educator Arthur Robinson wrote that its “land masses are somewhat reminiscent of wet, ragged, long winter underwear hung out to dry on the Arctic Circle” — and observers noted that Peters’ native Germany suffered less distortion than the underdeveloped nations he was trying to help.

To quell what they felt was an ill-founded controversy, in 1990 seven North American geographic organizations adopted a resolution urging media and government to stop using all rectangular world maps “for general purposes or artistic displays,” as they necessarily distort the planet’s features. That included both Mercator’s and Peters’ projections.

Peters’ map wasn’t even new. It had first been proposed by Scottish clergyman James Gall — who had noted in 1885 that “we may obtain comparative area with mathematical accuracy” by using this projection, but “we must sacrifice everything else.”

A Call for Change

https://pxhere.com/en/photo/551949

The most common coins in U.S. circulation are worth 1¢, 5¢, 10¢, and 25¢. University of Waterloo computer scientist Jeffrey Shallit found that with this system the average cost of making change is 4.7; that is, if every amount of change between 0¢ and 99¢ is equally likely to be needed, then on average a change-maker must return 4.7 coins with each transaction.

Can we do better? Shallit found two four-coin sets that reduce the average cost to a minimum: (1¢, 5¢, 18¢, 25¢) and (1¢, 5¢, 18¢, 29¢). Either reduces the average cost to 3.89.

“We would therefore gain about 17% efficiency in change-making by switching to either of these four-coin systems,” he writes. And “the first system, (1, 5, 18, 25), possesses the notable advantage that we only need make one small alteration in the current system: replace the current 10¢ coin with a new 18¢ coin.”

(Jeffrey Shallit, “What This Country Needs Is an 18¢ Piece,” Mathematical Intelligencer 25:2 [June 2003], 20-23.)

Even Sevens

A three-digit number is evenly divisible by 7 if and only if twice its first digit added to the number formed by its two last digits gives a result that’s divisible by 7. So, for example, 938 is divisible by 7 because 2 × 9 + 38 = 56 = 7 × 8.

In fact this can be extended to numbers of any length: 229187 → 2 × 2291 + 87 = 4669 → 2 × 46 + 69 = 161 → 2 × 1 + 61 = 63 = 7 × 9.

(J. Kashangaki, “A Test for Divisibility by Seven,” Mathematical Gazette 80:487 [March 1996], 226.)

Figure and Ground

https://patents.google.com/patent/US4627622A/en

Because we live on land, we tend to make maps in which oceans are afterthoughts, mere spaces between the continents. In 1986 oceanographer Athelstan Spilhaus sought to remedy this with a cartographic puzzle in which seven pieces can be combined in various ways, each presenting “a different, but equally valid, viewpoint of the features of the earth.”

Above, they’re arranged to show that “the land masses of North and South America, on the one hand, and those of Europe, Asia, and Africa on the other, are maintained in associated groupings, while the vastness of the Pacific Ocean has been set off to the left of the map.”

But the same seven pieces might be rearranged to illustrate the fact that “the Pacific Ocean widely separates Asia from the Americas.”

In 1942 Spilhaus had also devised a world map in which the oceans take the forefront, reminding us that Earth is “a water planet, with a single great ocean covering nearly three-quarters of its surface.”

Volume Control

https://commons.wikimedia.org/wiki/File:Caricature_of_a_Tall_Thin_Man_Carrying_a_Book_MET_DP803932.jpg

I just thought this was interesting: In the 1970s a little spate of studies investigated why men and women carry books in stereotypically different ways. A 1976 study in Tennessee found that by junior high school males tended to carry books at their sides, with the arm relatively straight and the hand cupped under the book’s lower edge. Females cradled a book in the arm at the front side of the body, resting on the hip or pelvic bone.

A second study in the same year ruled out some theories: It found that men and women carried books of roughly equal weight, and that both had hand grips strong enough to carry their books in either position. (Also, carrying purses didn’t significantly alter the way women carried their books.)

A University of Washington study two years later replicated the earlier findings but suggested that “women with hips that extend past the comfortable fall line of the arm along the side of the body will not show the side carry typically seen in males.” (“In effect, the hip in females fills the side space that males fill with their books.”)

But a re-examination 15 years later found that the picture was changing: While 90 percent of the men still carried books at their sides, now so did 43-60 percent of the women. So perhaps it’s not correct to speak of these as intrinsically masculine and feminine styles. But that raises another question: “why … men’s carrying behavior is uniform and stable, whereas women’s behavior is more varied and changing.”

(Thomas P. Hanaway and Gordon M. Burghardt, “The Development of Sexually Dimorphic Book-Carrying Behavior,” Bulletin of the Psychonomic Society 7:3 [1976], 267-270; Philip J. Spottswood and Gordon M. Burghardt, “The Effects of Sex, Book Weight, and Grip Strength on Book-Carrying Styles,” Bulletin of the Psychonomic Society 8:2 (1976), 150-152; Judith D. Scheman, Joan S. Lockard, and Bruce L. Mehler, “Influences of Anatomical Differences on Gender-Specific Book-Carrying Behavior,” Bulletin of the Psychonomic Society 11:1 [1978], 17-20; Evelyne Thommen, Emiel Reith, and Christiane Steffen, “Gender-Related Book-Carrying Behavior: A Reexamination,” Perceptual and Motor Skills 76:2 [1993], 355-362.)